
Debug private minified production CSS easier
Load private CSS source maps manually in Chrome DevTools to un-minify them.

I’m Jecelyn Yeen, currently working on Chrome Tooling - Chrome DevTools, Puppeteer and more at Google. I tend to talk about web development, debugging & testing.
Prefer video over text? Head to the end for the video version.
Got private CSS source maps tucked away? You can now use them in Chrome DevTools to debug even in production environments!
Here's the scenario: You've built a web page using TypeScript and SCSS. They get compiled into JavaScript and CSS, along with two helpful source map files (e.g. a.js.map, b.css.map).

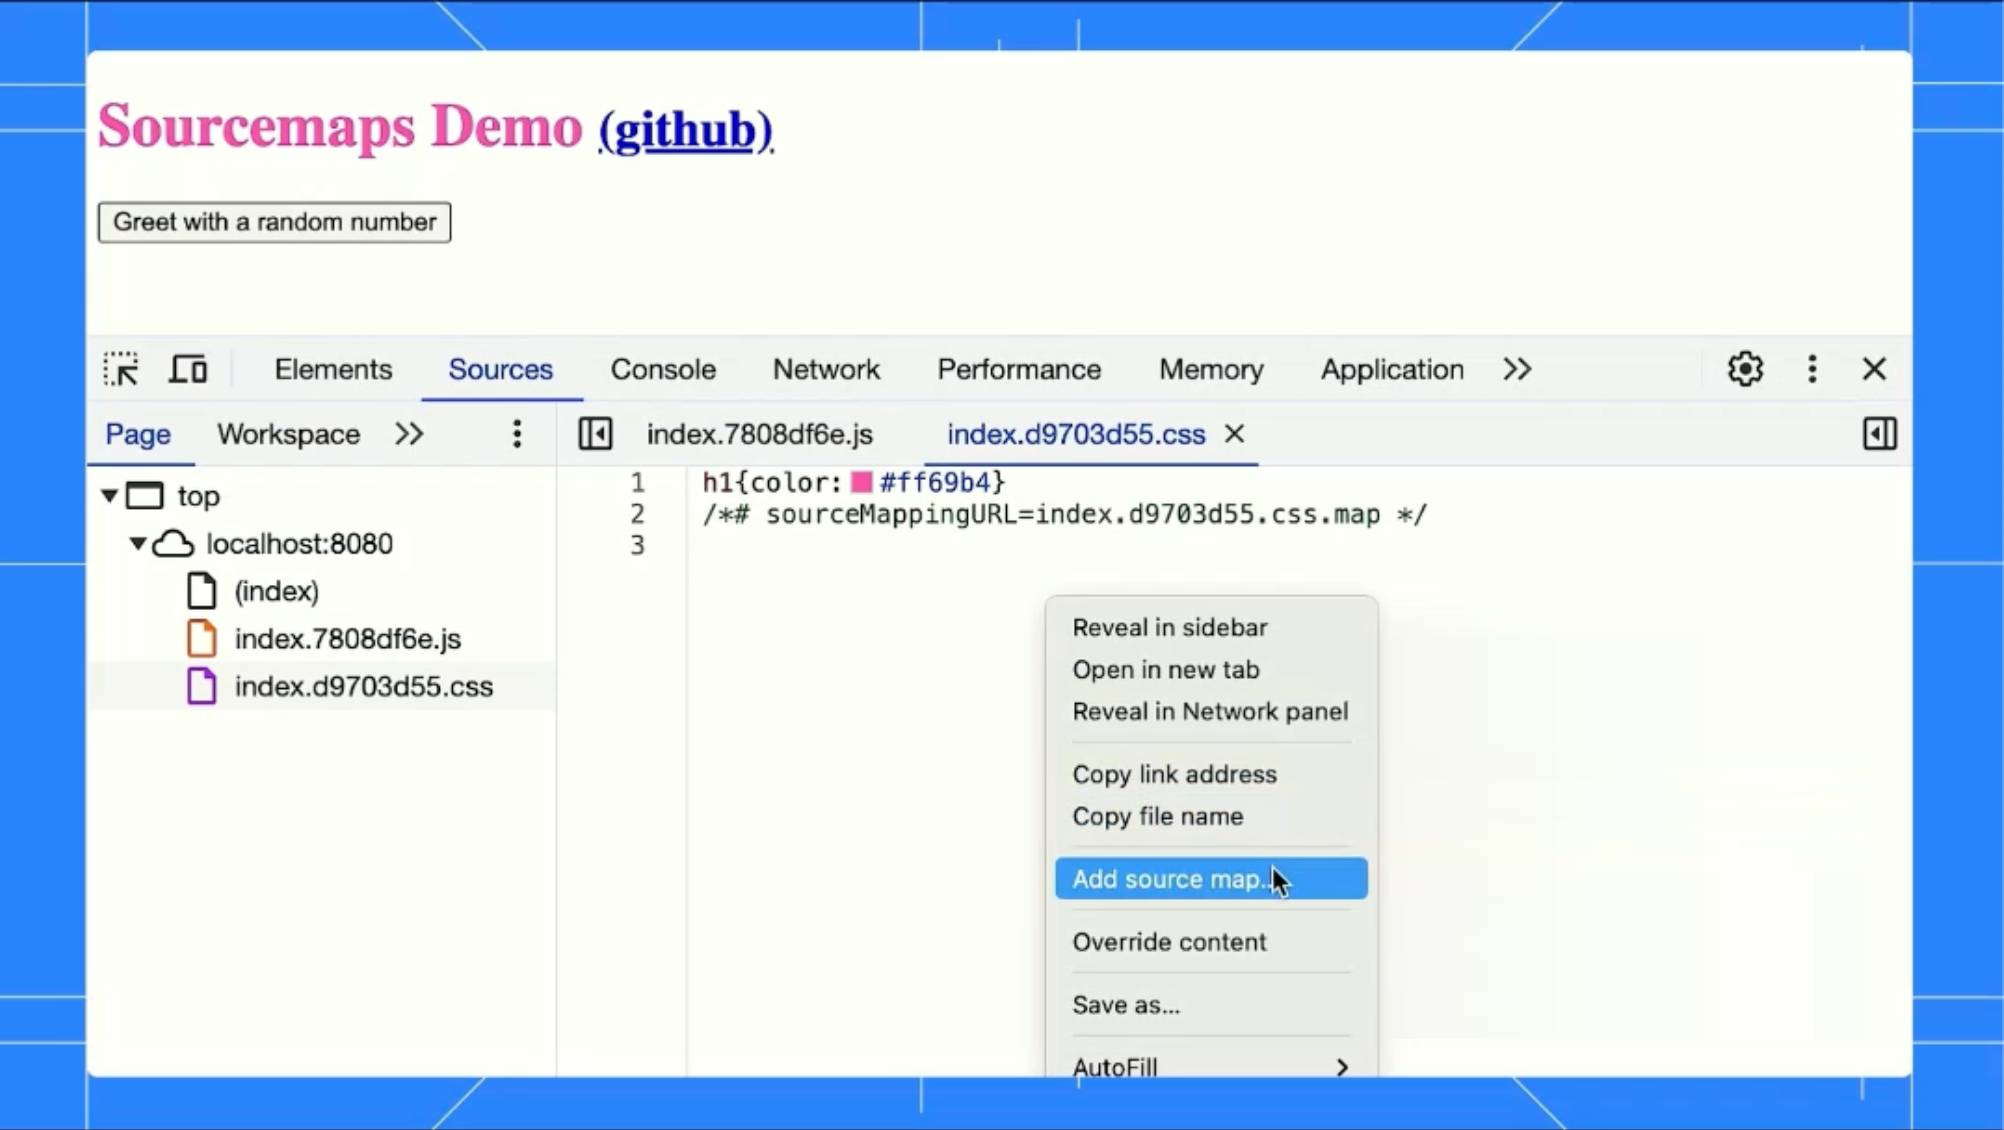
Production woes: It's common to skip deploying source maps in production for security reasons. However, this makes debugging a headache as you're stuck deciphering minified code.
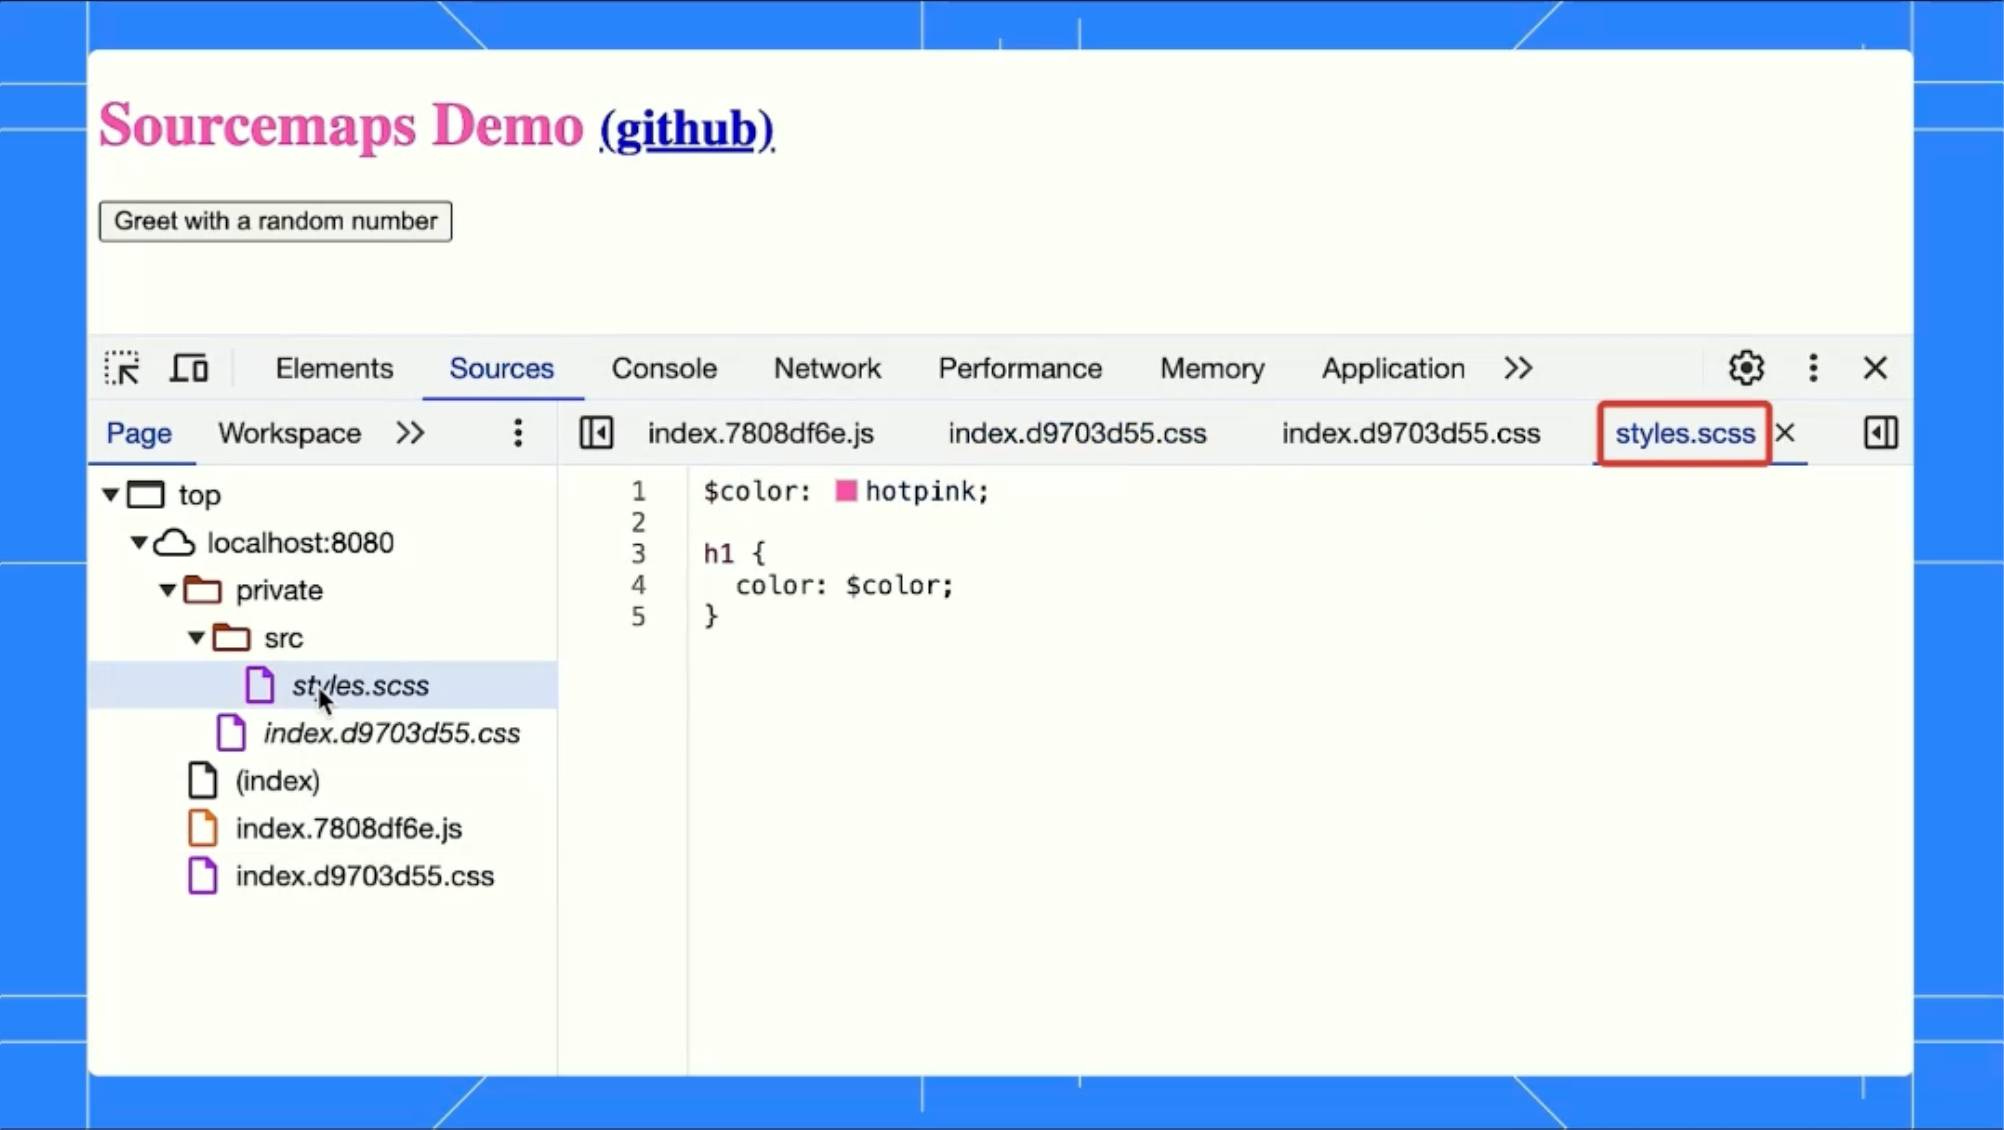
The secret weapon: Now, you can right-click and manually add your source map to DevTools! This instantly transforms the messy code into its original, readable format, making CSS debugging a breeze.
Fun fact: Did you know this handy feature has been around for JavaScript for ages?
Share your thoughts: Have you used this trick to debug CSS in production? Let us know in the comments below!