
Debug WebAssembly with Chrome DevTools
Yes but you need an extension for that.

I’m Jecelyn Yeen, currently working on Chrome Tooling - Chrome DevTools, Puppeteer and more at Google. I tend to talk about web development, debugging & testing.
Prefer video over text? Head to the end for the video version.
Awesome news! DevTools now lets you debug C and C++ code in your WebAssembly (wasm) applications. This means you can easily explore and fix issues in your code, just like you do with JavaScript.

You need to install the WebAssembly Debugging extension. This helps DevTools understand the debugging information stored in your wasm files.
Once installed:
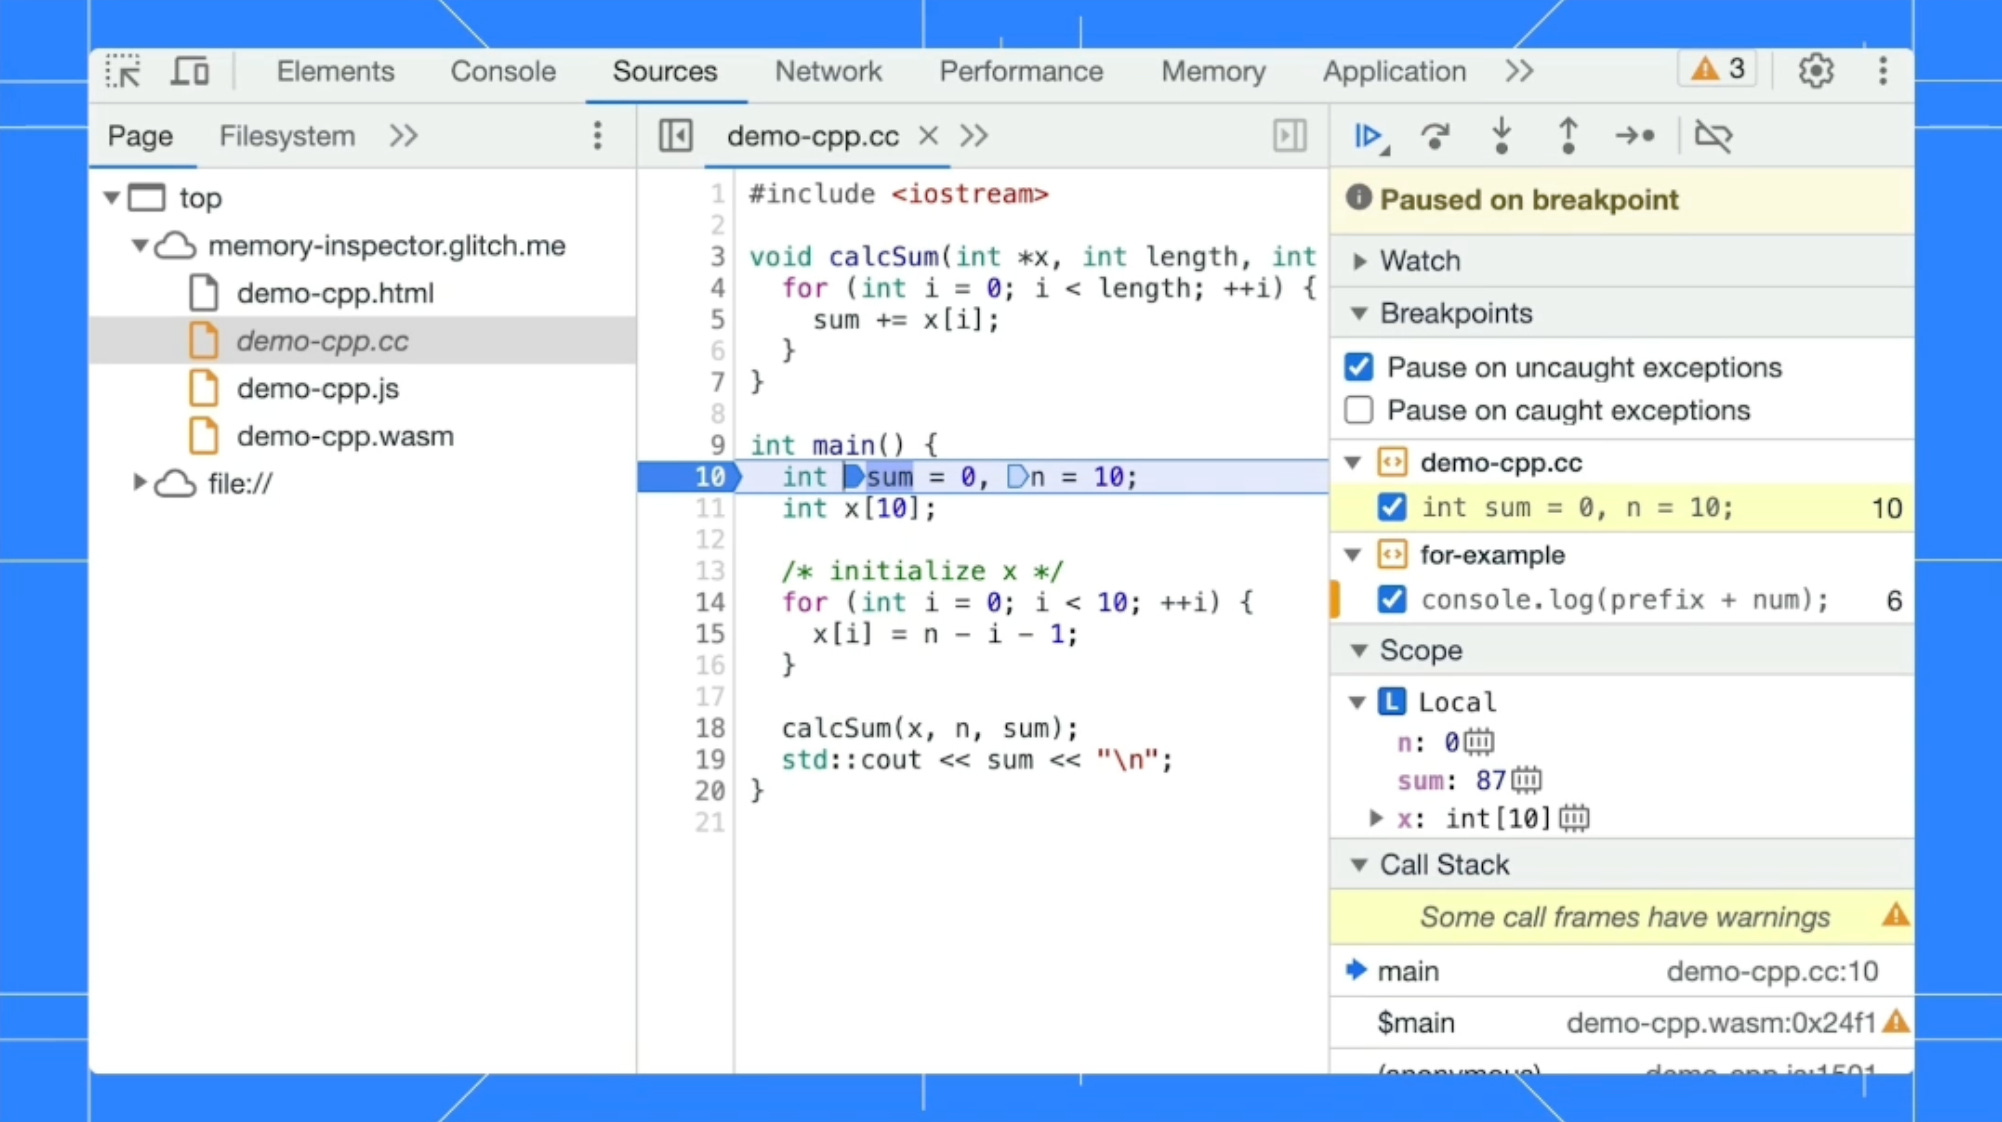
You'll see your C++ source files right inside your application.
Open them to view the code, set breakpoints (stopping points), and start debugging!
We've also made "stepping over" code smoother so you can navigate easily.
Bonus: We've also improved how the debugger works with WebAssembly disassembly files, making your debugging experience even better!
Want to learn more? Check out this link for more information on debugging WebAssembly: goo.gle/devtools-wasm.